
The last couple of weeks have offered “interesting” markets (May we live in volatile times), but also a high degree of differentiated performance for trend following strategies, with some strategies recording negative numbers while others offer a degree of equity market protection. We are currently updating data for February and expect to publish a new database snapshot on Sunday.
Commonly, for event-driven market development, two factors explain the divergent performance – Timeframes and Sector allocation.
To illustrate the impact of different timeframes, we use a standardized Breakout strategy (all performance here is simulated and hypothetical) with lookbacks ranging from 5 to 160 days, which takes a short position when they identify a lower low over the number of days that is applied to the strategy. Higher highs are taken on the reverse of the rule. To manage the volatility of the strategy, we size inversely proportional to the rolling Average True Range. As you may already have concluded, this is only one way of many to identify trends, that said, the results are interesting.

The chart gives an immediate understanding of why there is dispersion this month. Short-term timeframes generally did well, while longer time generally sold off with the equity market. The equity market is proxied with the continuous CME S&P E-mini Future. The performance of the 20-day breakout is interesting, as this would be a strategy that is relatively short-term but yet managed to get whipsawed several times. This episode was a month of strong performance for short-term breakout traders in the equity market.

For Fixed Income, using the continuous 10-year bond Future (CME), we note that regardless of timeframe, trading was generally profitable throughout this event. From a trend following perspective, it was near impossible to be caught wrongfooted in bonds.
From this, we draw the somewhat shaky conclusion that the performance of trend managers will relate to your long-term allocation to equity markets and the time-frame.
To get an indication of how CTAs are performing we would recommend the NilssonHedge CTA index. From this, it is at least indicative that a lot of the managers in the index had a bit too much equity or traded those markets too slowly.
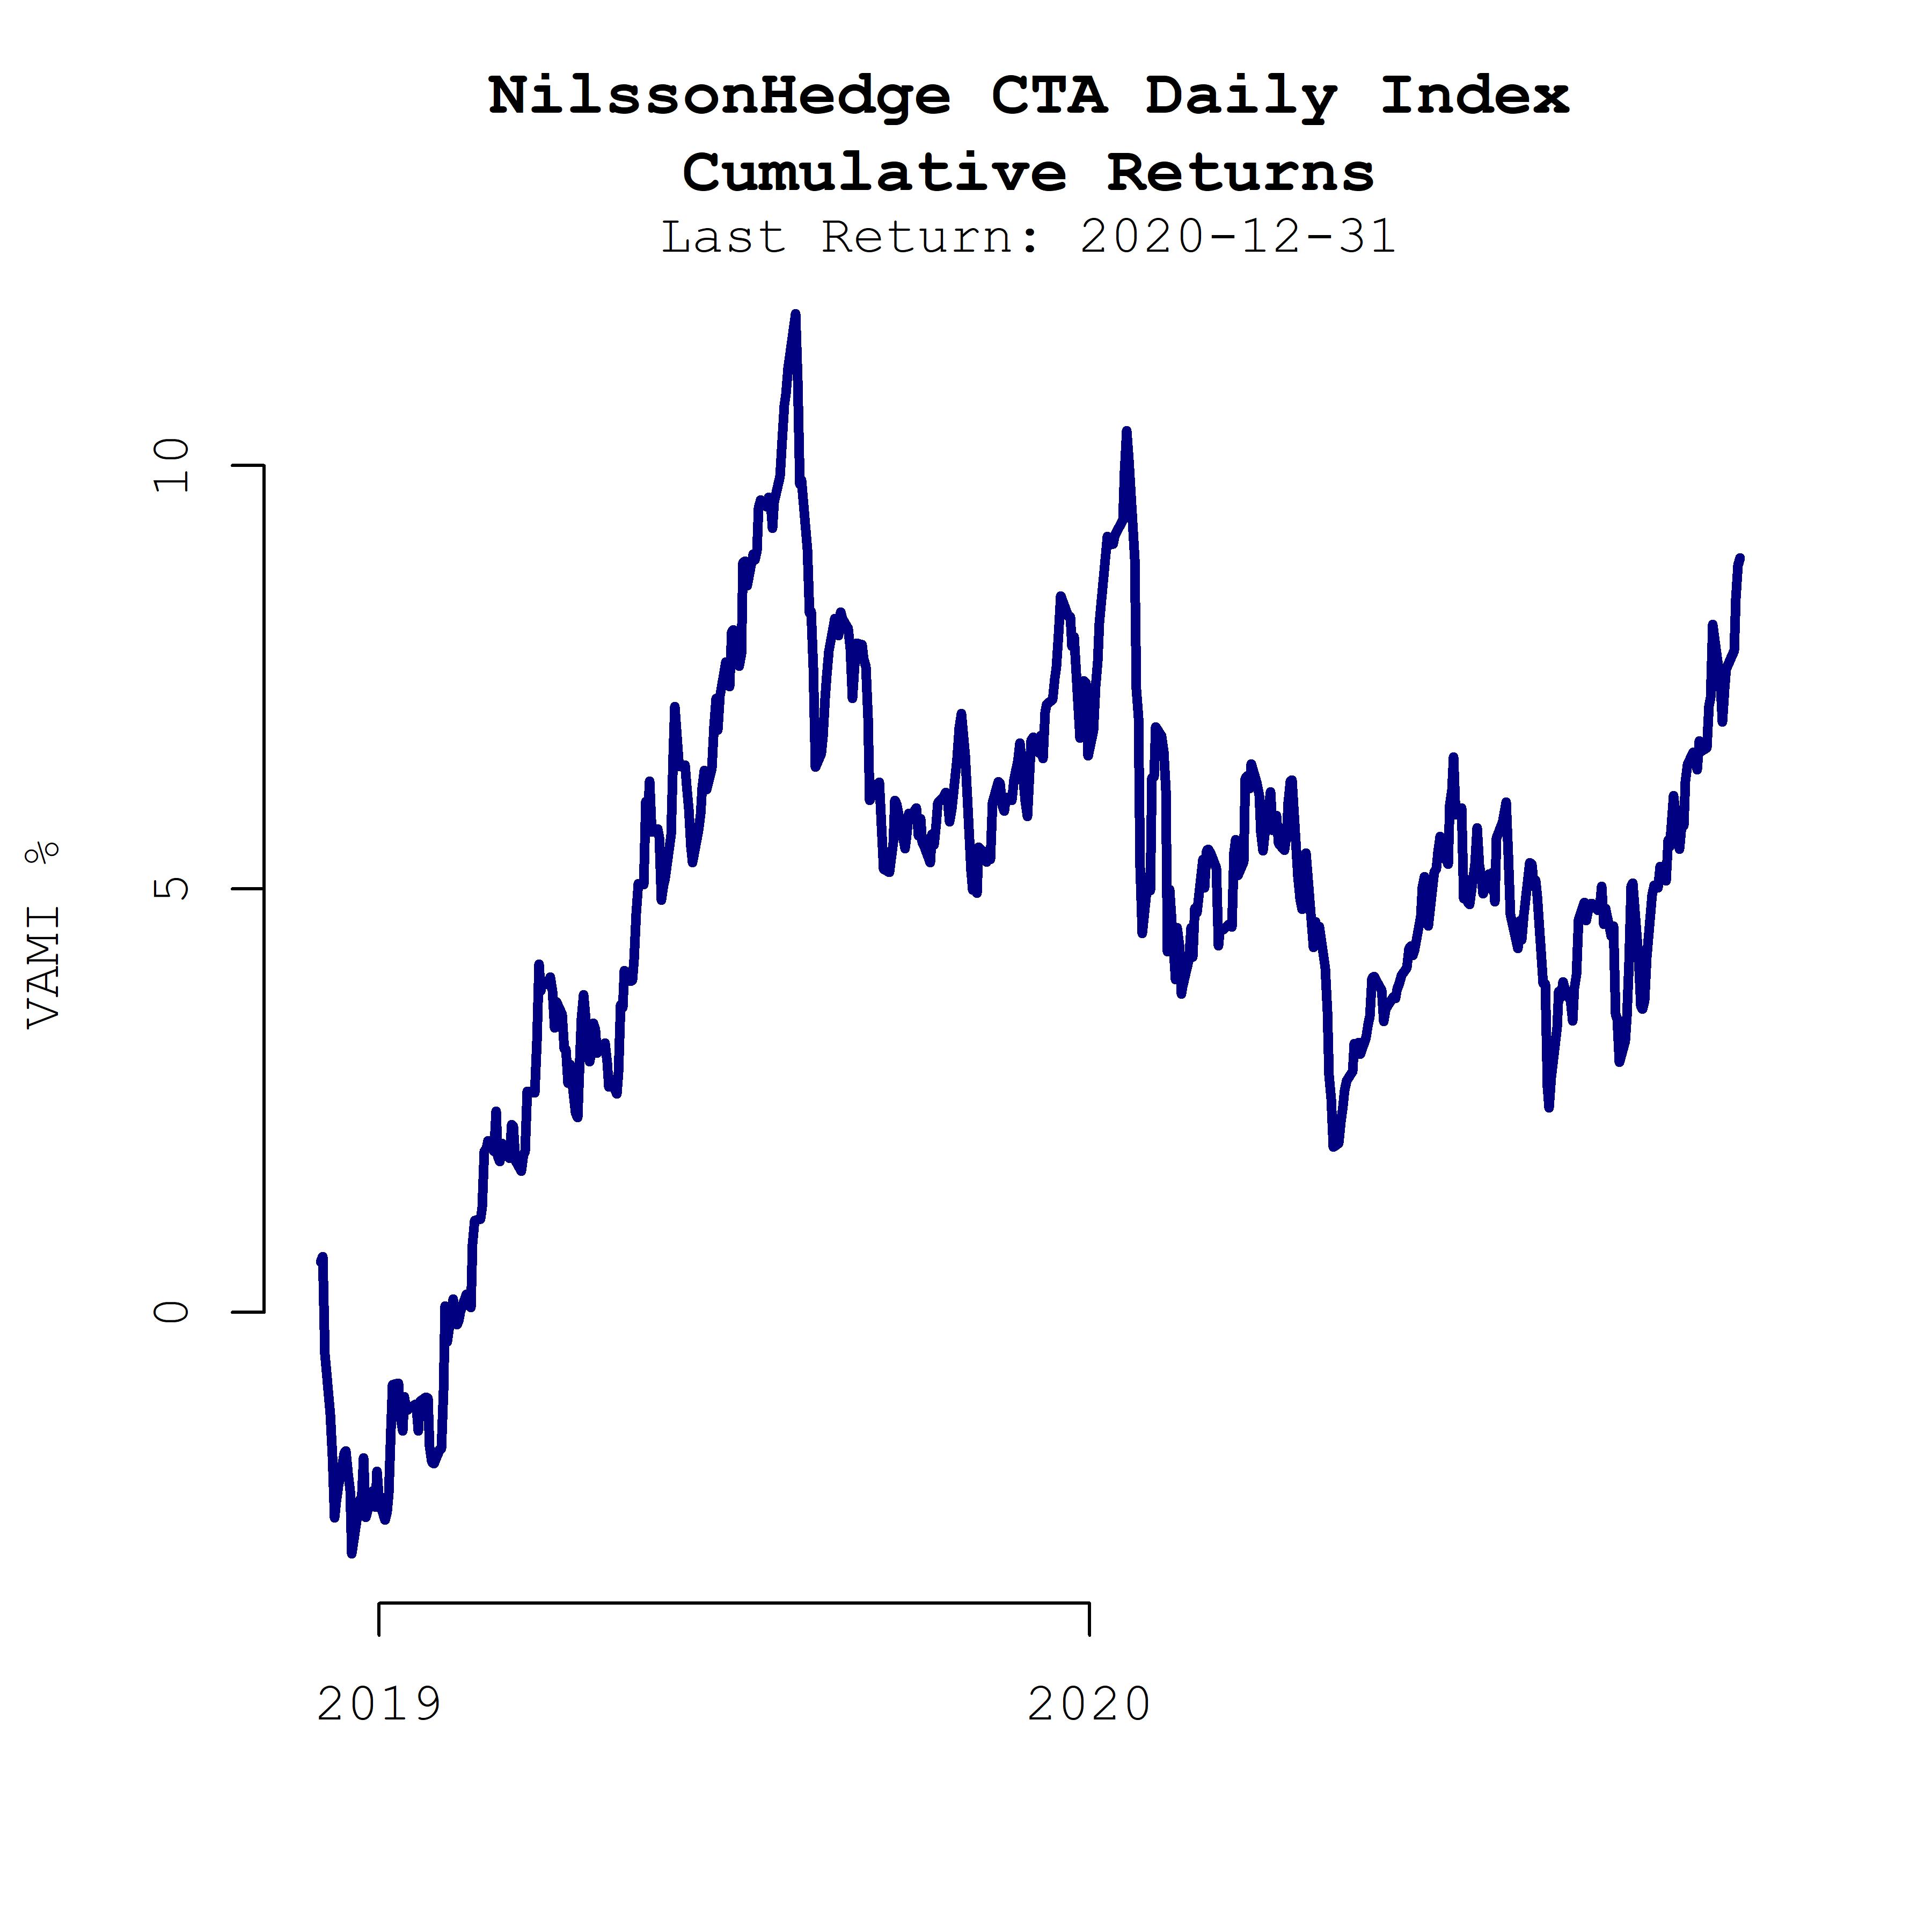
The NilssonHedge indices can be accessed here. Sign up for the underlying database here (free).
Photo by Thomas Millot on Unsplash