
While past performance is not indicative of future results, it is immensely satisfying to own managers amongst the best performing managers for the year or month. Likewise, it is excruciating to have exposure to the worst ones. NilssonHedge tracks the best and worst managers per strategy group. These reports are updated throughout the month, as more data arrives. This page shows the best and worst managers that we have classified as Asset Allocation strategies.
Asset allocators try to compose robust short and long-term portfolios based on asset class views. These funds may have different risk levels (e.g. Conservative, Moderate, or Aggressive, or similar terms). Often the level refers to the percentage of equities owned by the strategy. Typically, these funds are highly correlated as the number of asset classes bets is relatively few.
The Top 10 Asset Allocation and Worst 10 Asset Allocation funds for the reporting month are shown below. This is based on our proprietary composite data streams but may contain errors. These are not filtered for Asset Under Management and are ranked on a simple return metric without adjusting for volatility.
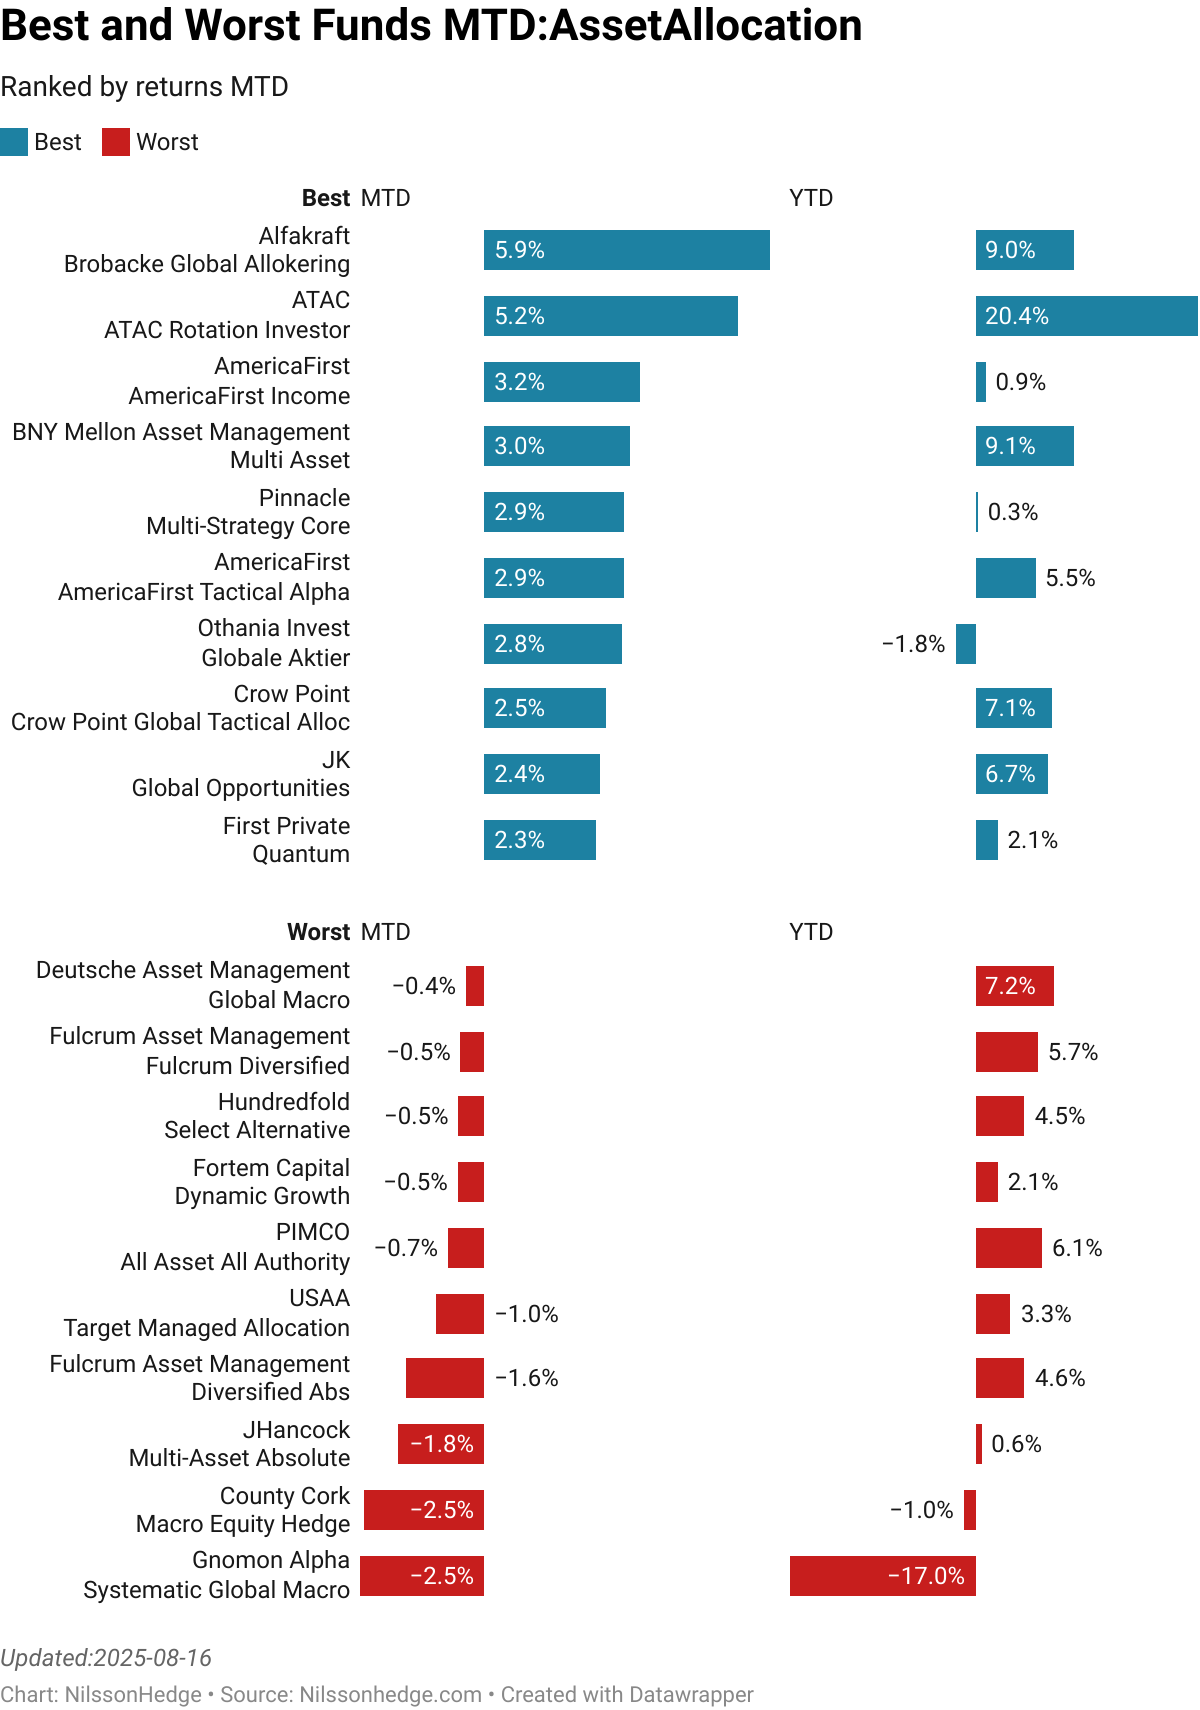
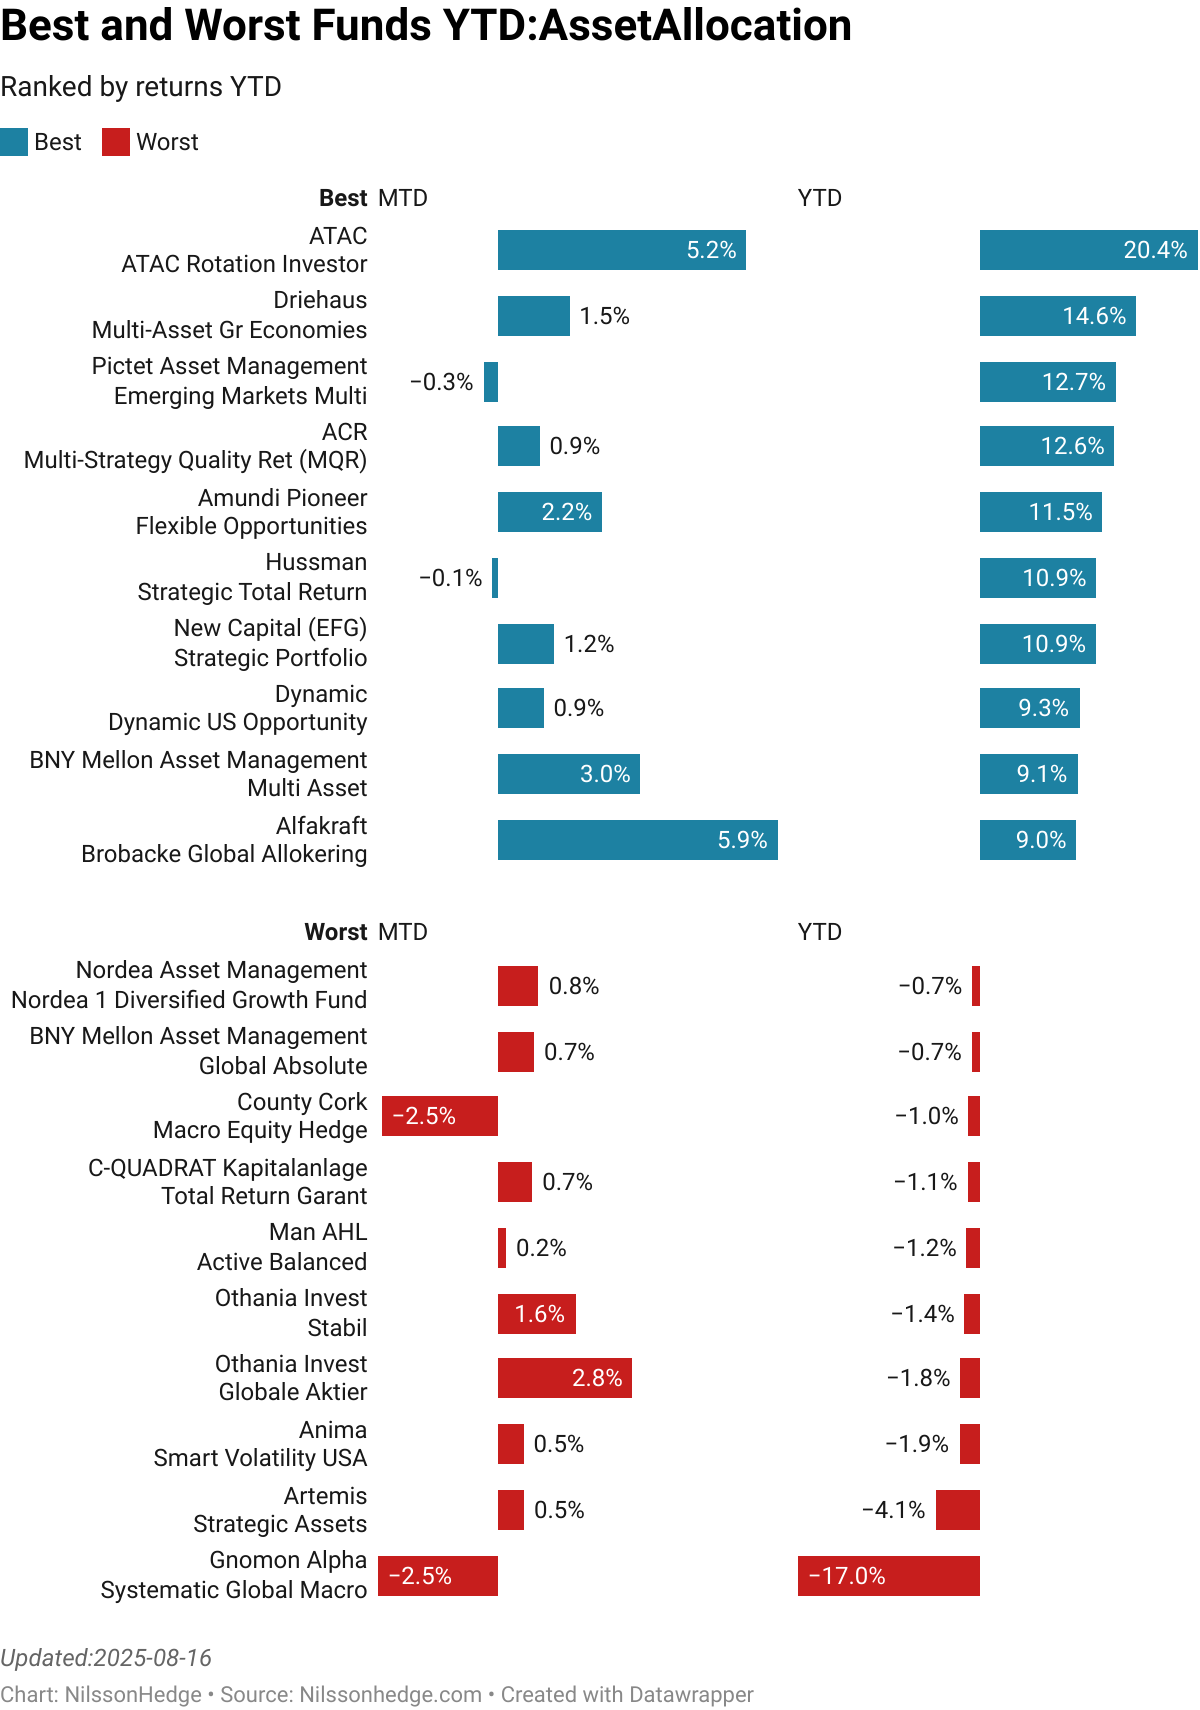
These reports may not always display the correct results, so please verify the returns before taking a victory lap through the office. NilssonHedge does not endorse any managers on the list and ending up at the top or bottom probably tells you more about the risk of a particular than anything else.

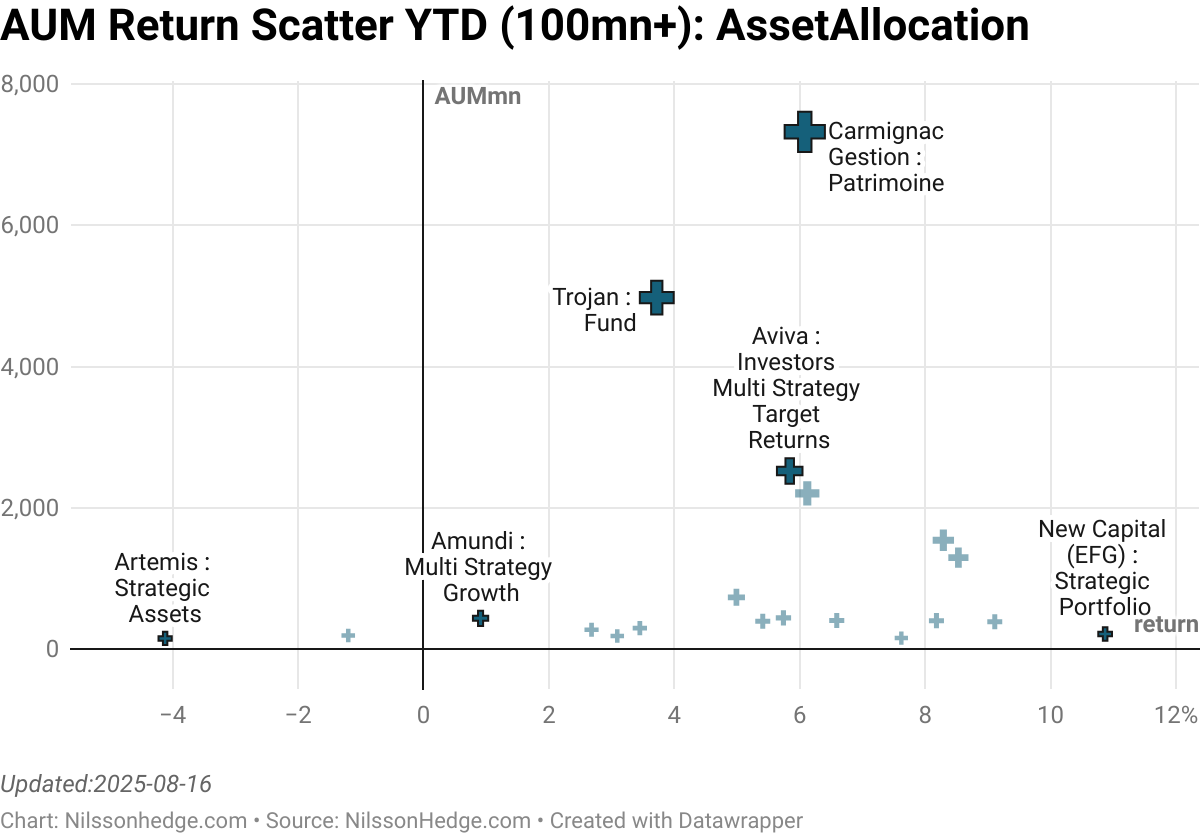
The scatter plots above show the relationship between AUM and Returns (MTD/YTD). Large managers have progressively larger markers, showing that they have earned or lost more money. In some cases, we do not have reliable AUM numbers.
There may be additional funds that are better or worse, that we have not captured in our database. Please do tell us if we are missing your fund and we are happy to capture the data.