We present rolling 21-days (roughly equal to one month) correlation and beta for the daily hedge fund indices that we calculate. These measures give an indication of exposure and how the underlying managers have been positioned. We calculate Beta and Correlation against US Equity markets, US Bonds (10-year), Currencies (as a short exposure to the US Dollar), Energy (US Crude Oil), Precious Metals (Gold), and Crypto Currencies (Bitcoins). This gives you an indication, not only about contemporary exposures but also about the trading style. Interpret the charts with some skepticism as it does not necessarily reflect the underlying exposures, but may only be a mathematical mirage. We use a basket of large ETFs to calculate the statistics.
The mathematics of Correlation and Beta calculations are very similar, but yet give slightly different information. A manager may be highly correlated to market, but if the Beta is low, then the exposure will not have a large financial impact. Gray areas show significant equity market drawdowns.
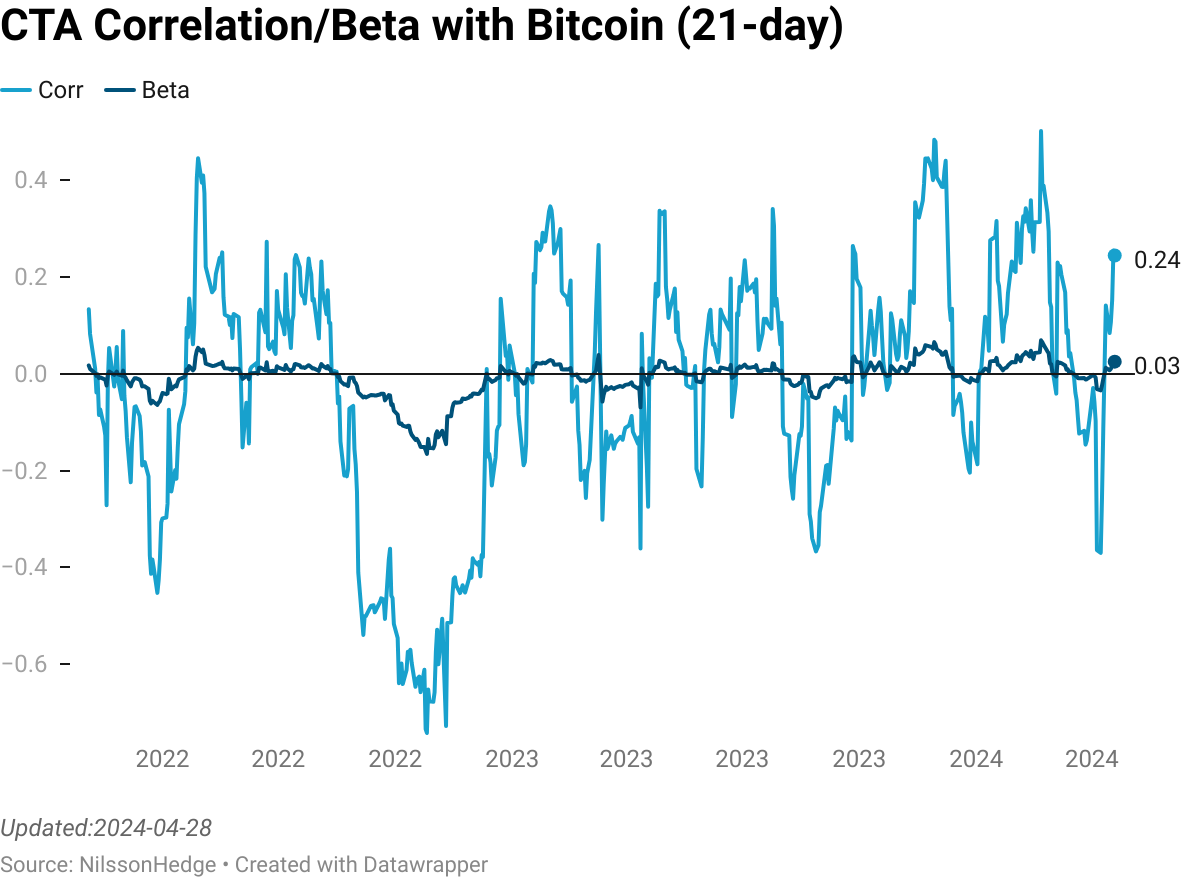
CTA/Managed Futures
CTAs do generally have time-varying exposures to all of the Global Macro markets. As the index mostly consists of Trend Following managers that means that the comovement data will largely be a factor of how markets have moved recently. Long exposures to markets will generally be taken once a positive trend has been established, resulting in positive correlation. Short exposures to markets will generally be taken once a negative trend has been established, resulting in negative correlation.


Equity Long/Short
Equity Long/Short managers should be expected to be correlated to equity markets (with some potential to mitigate risk by reducing equity beta). Most of the markets have some degree of spurious correlation, but high and persistent measures may indicate that there is some implicit exposure to other Global Macro factors. Typically the Beta to equity markets for this group is lower than one, 0.5 is a good yardstick.


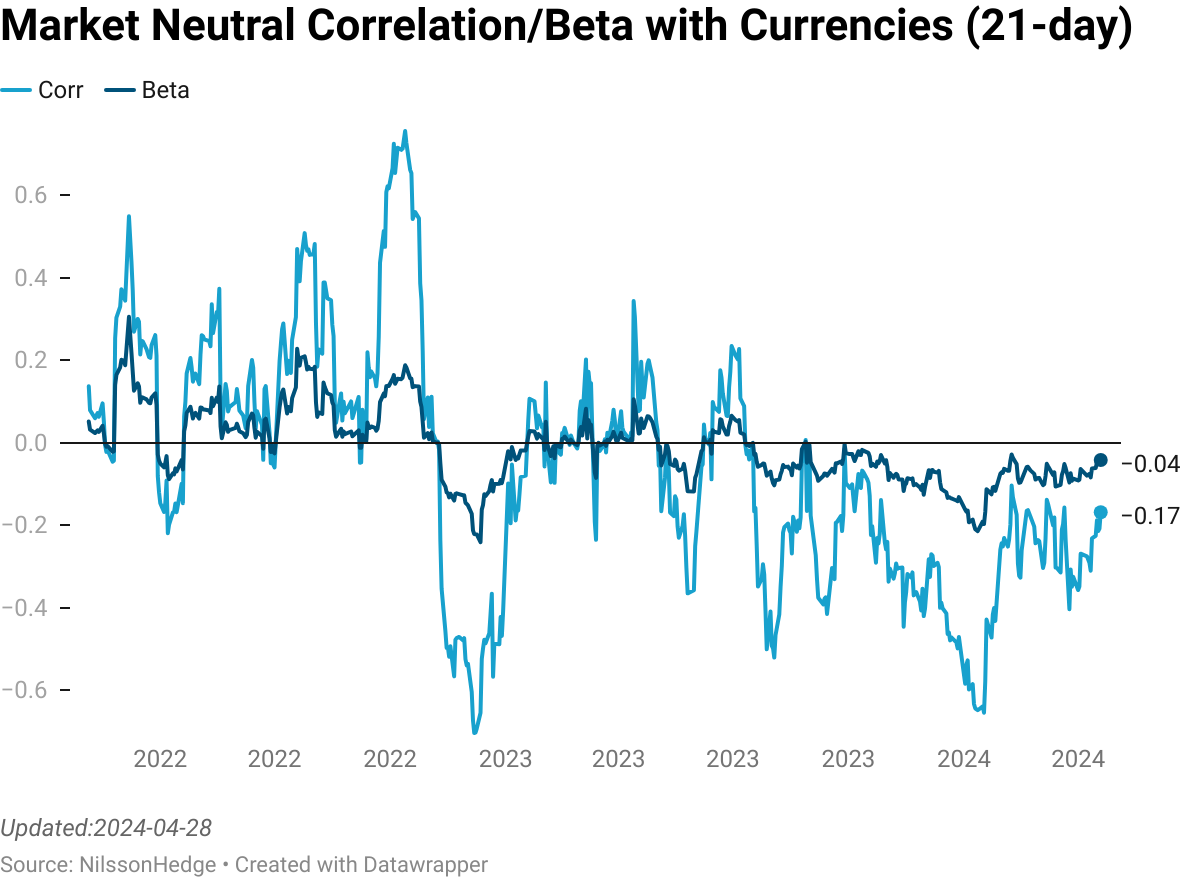
Market Neutral
Market Neutral strategies are designed to be neutral to Equity Markets which is generally born out in the low beta measure to those markets. Furthermore, there is a low correlation against Energy and Precious markets, which can also be represented as sector views in Stock markets. While striving to neutralize equity market exposure, we still observe time-varying, and mostly positive, correlation.


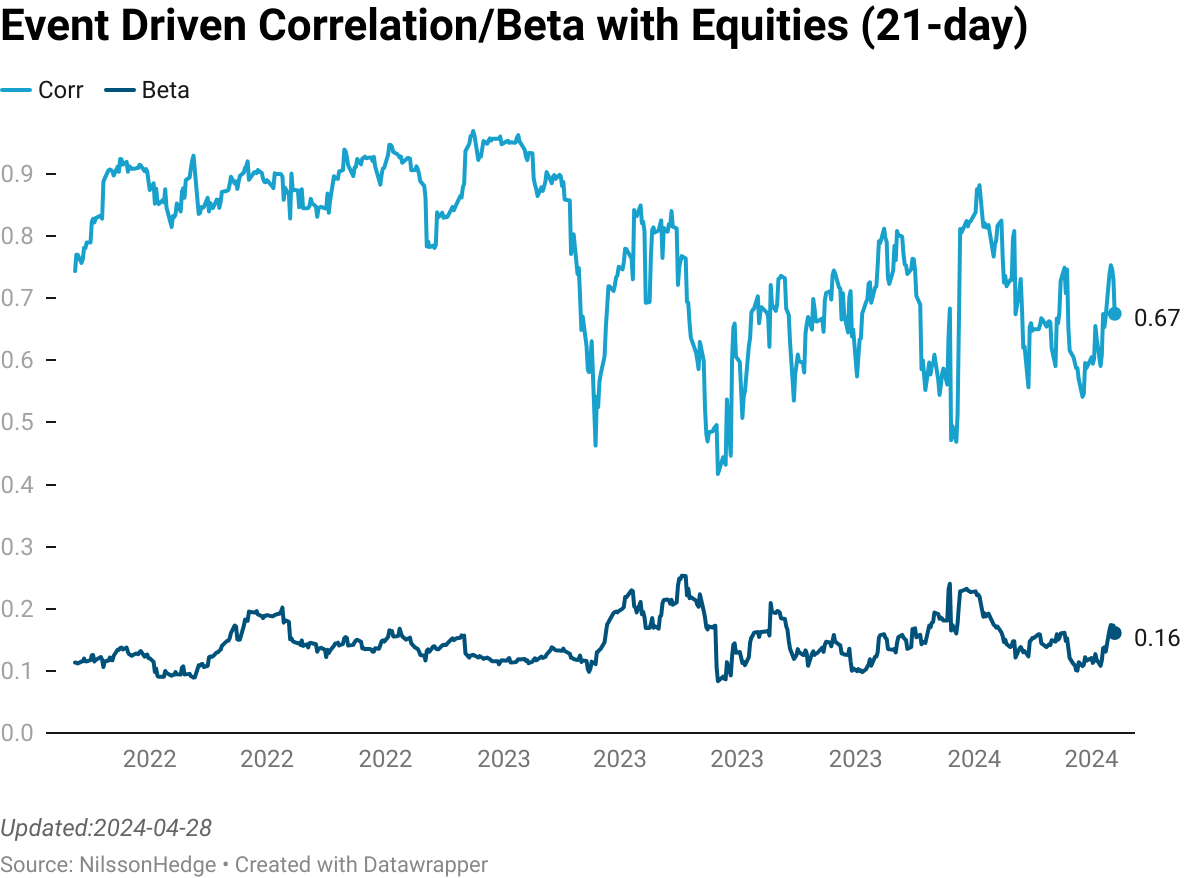
Event Driven
Event-Driven strategies are involved in various market events, primarily in situations surrounding mergers and acquisitions, bankruptcies, corporate restructuring, liquidity events, and spinoffs trying to exploit mispricings in markets. From this strategy, you should typically expect a low Beta to equity markets, but worsening financing conditions during equity market stress periods may cause correlation to increase temporarily.


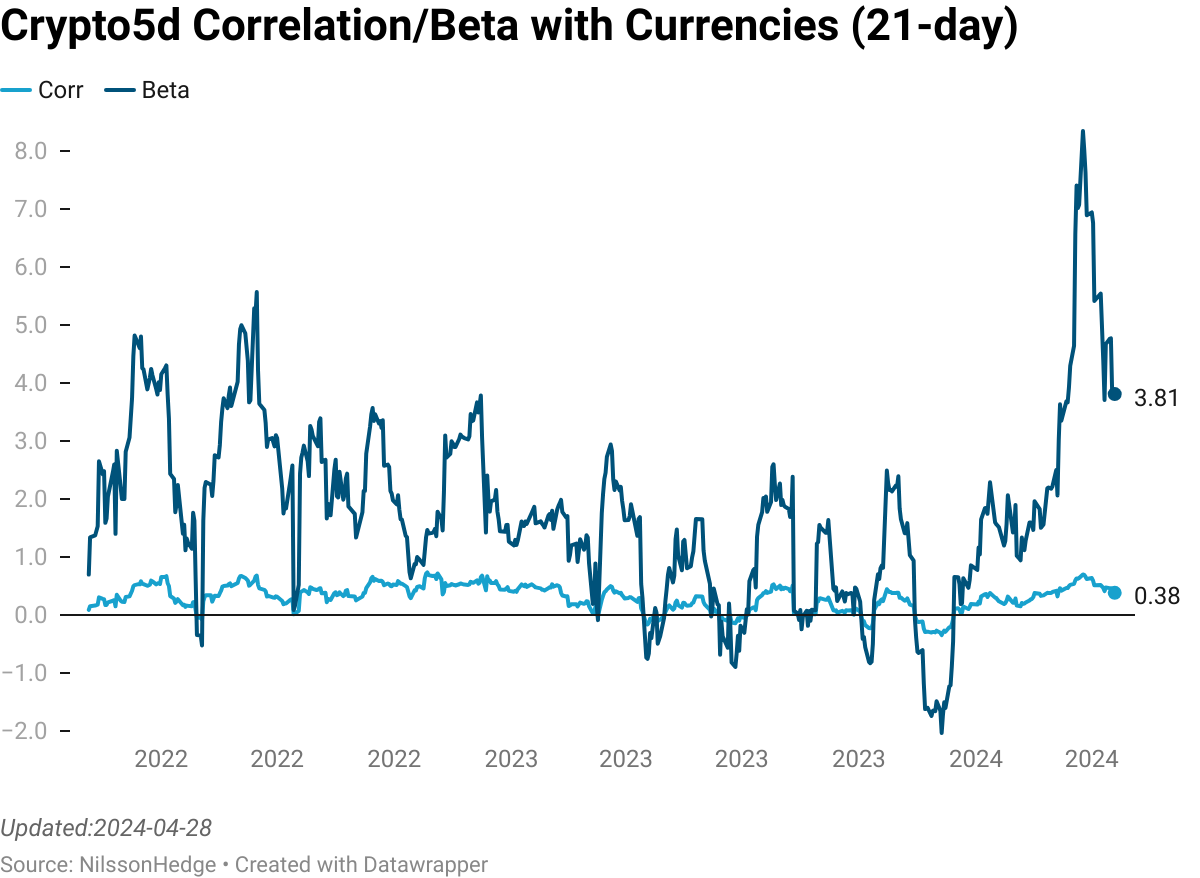
Crypto
Crypto trading is the new kid on the block, representing managers that have exposure to a diverse range of Digital Assets, including Bitcoin and “Alt-Coins”. We observe that there seems to little correlation with traditional macro markets. Noteworthy is a majority of the strategies that we capture on a daily basis does not have a large correlation to Bitcoins per se. As a footnote, we have moved the weekend returns of the Crypto Index to Mondays to avoid any correlation effect.