
Factors can be used to explain performance ex-post and to understand a trading style. This approach may be useful to identify managers with either persistent skill, non-replicable exposure, or different characteristics compared to the rest of your portfolio.
We use the NilssonHedge hedge fund dataset to run a large-scale factor regression to explain returns. We find that the average fund has a 50/50 chance of outperforming the regression benchmark over rolling 24-month periods, but that some strategies have delivered alpha as of late. One of the key takeaways here is that it is difficult to select funds with above-average returns, but that dispersion is high in certain groups, leaving plenty of room for skilled fund selectors. In addition, we find that CTAs, Fixed Income, and Event-Driven managers have delivered positive alpha throughout the last 24 months.
Introduction to Factors
One of the few things we will all be able to agree on is that 2020 was a hectic year, especially for investors. From all-time highs in January and February followed by a Covid induced sell-off in March. This in turn followed by the largest Quantitative Easing on record, resulting in the prompt recovery of risky assets as liquidity was brought back into the system. Last year had it all. Rough seas might make great captains, but it is during these times that we can see whether some kinds of ships were better suited for the choppy seas.
Investors generally invest in Hedge Funds to earn alpha. As alpha tends to be expensive, investors want to ensure that they are not paying for easily accessible beta components. In this article, we denote alpha as performance in excess of the performance of a portfolio of factors constructed to replicate a fund’s returns. The factors we use do not include trading costs and other fees. The portfolios expressed by the factors are not always fully replicable and represent a backward-looking exercise to isolate ex-post alpha from the various fund managers. The five-factor model was published by Fama & French in 2015, and the data is sourced from the Kenneth French Data Library. We note that the factors are not out-of-sample for the whole period and that they have undergone several revisions.
Thus, alpha, in this article, is the return earned by a fund that cannot be explained by these factors using a rolling regression. A positive alpha means the fund is performing better than its replicating portfolio of factors, and a negative alpha means that the fund is underperforming its replicating portfolio of factors. The factors used are the Fama-French 5 factors plus a momentum factor. FF5 plus momentum is a standard and widely used approach, and the factors included are (all these factors, except the market factor, are derived from equity market neutral portfolios):
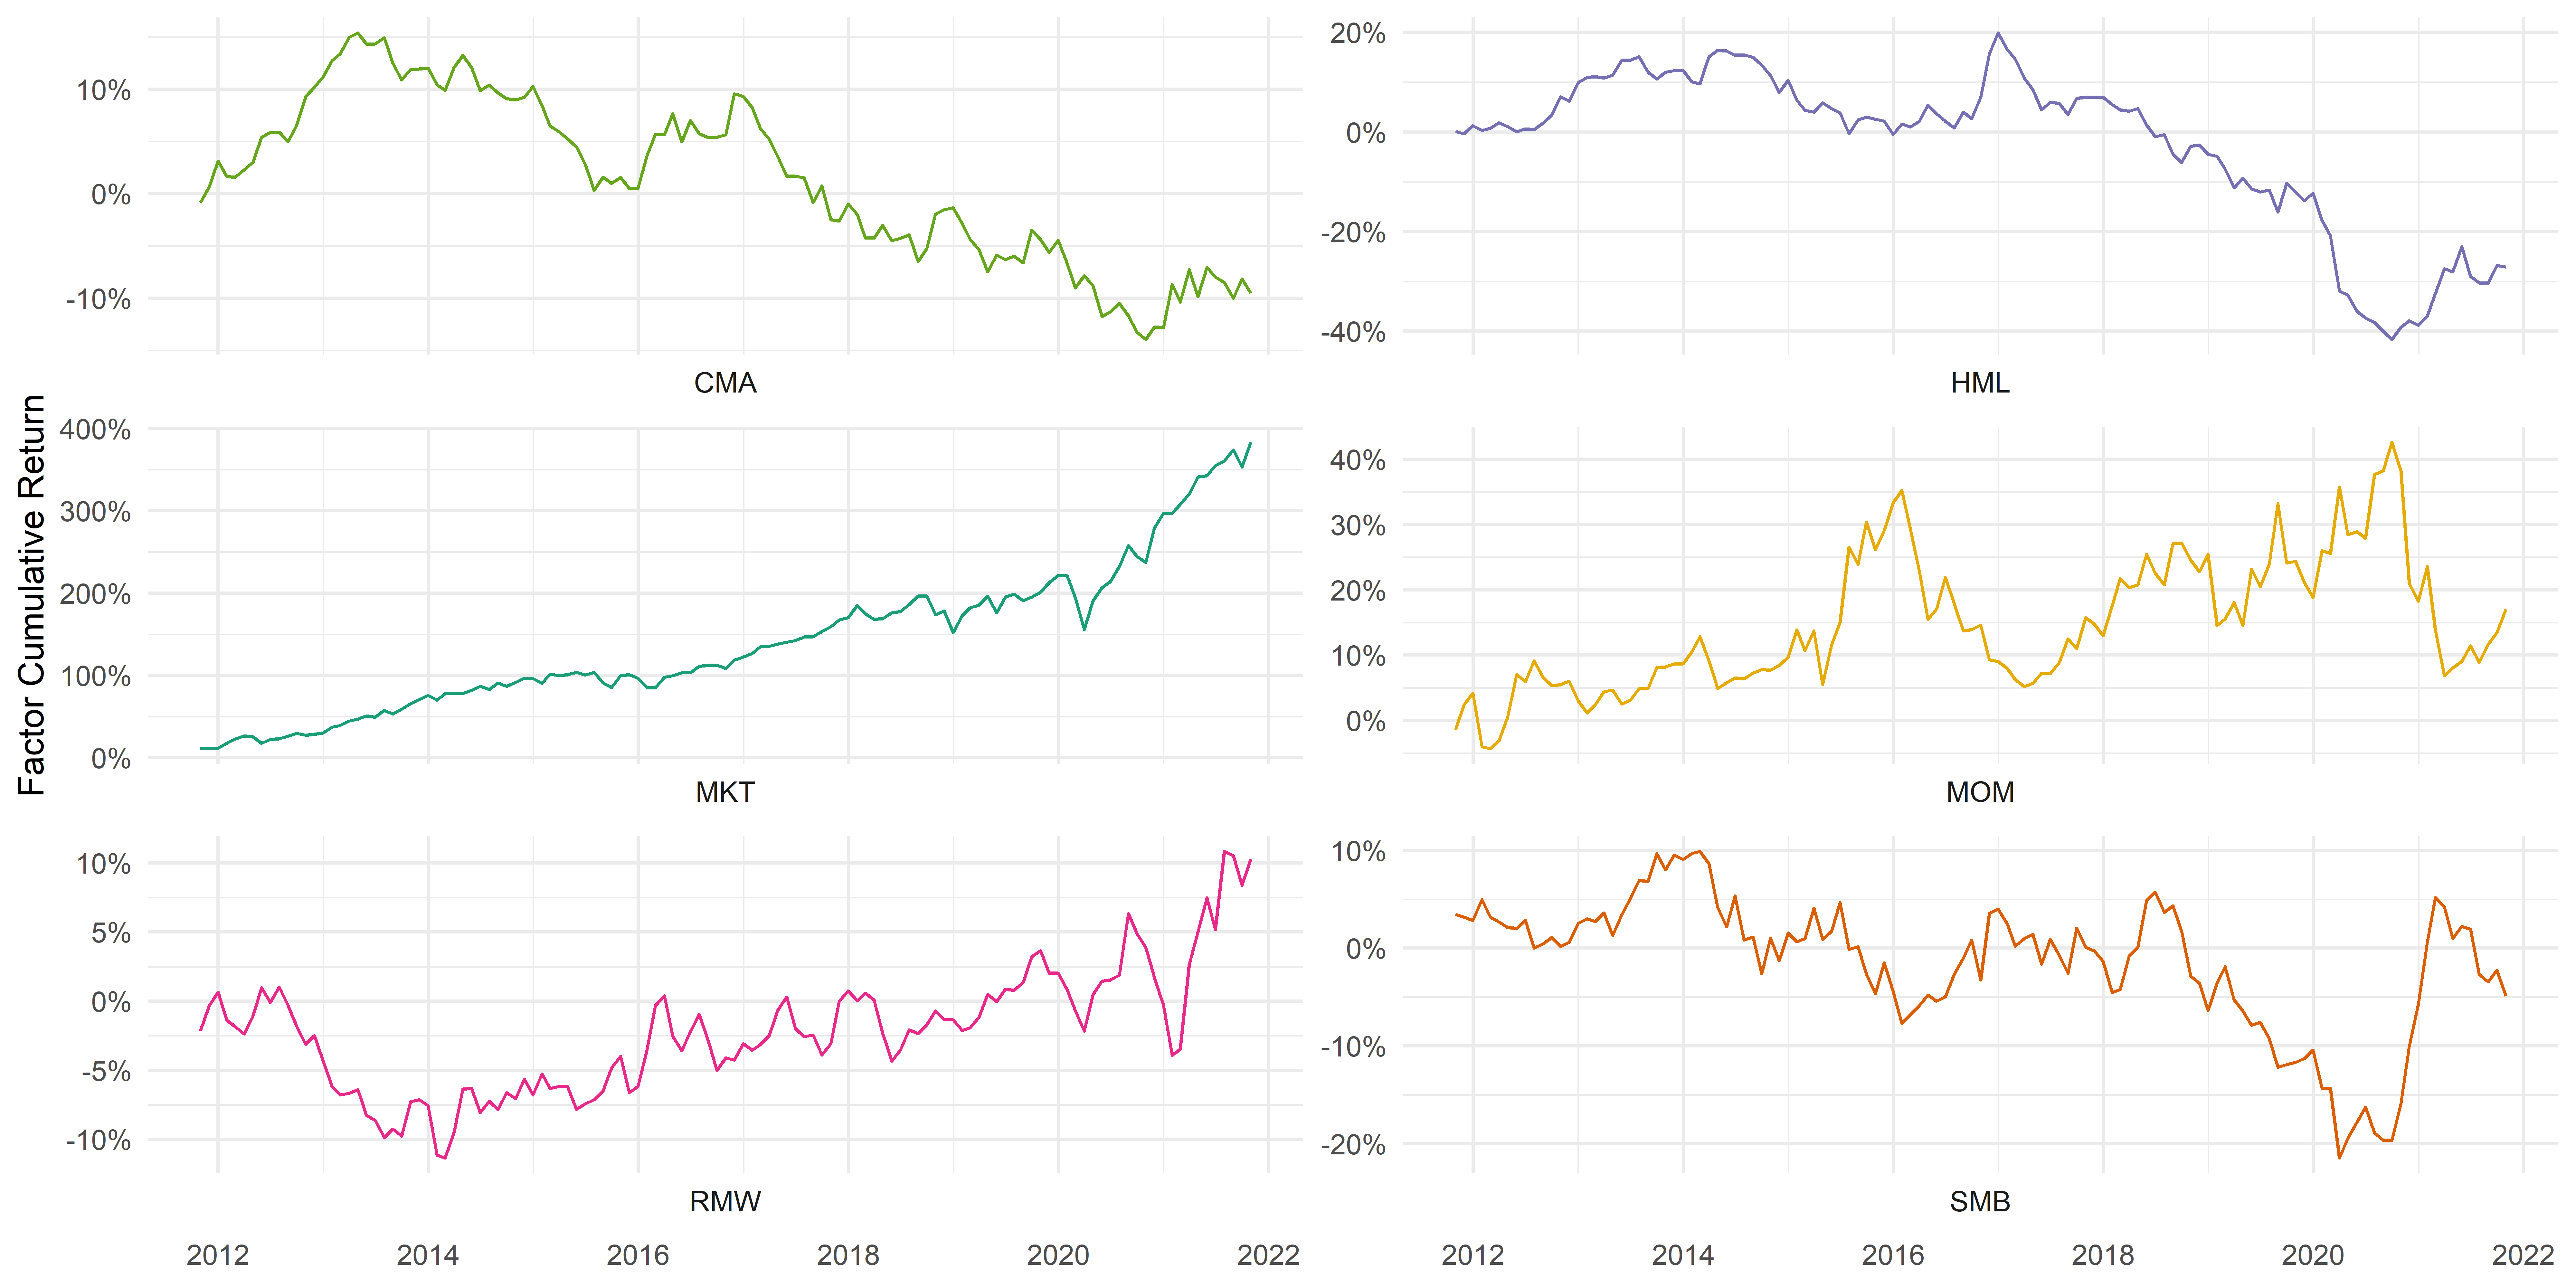
- MKT: Market returns in excess of the risk-free rate.
- SMB: Size, returns of a small stock portfolio minus a big stock portfolio.
- HML: Value, returns of a value portfolio minus a growth portfolio.
- RMW: Returns of a robust portfolio minus a weak portfolio. Robust” stocks have high operating profitability, and weak stocks have low operating profitability.
- CMA: Returns of a conservative portfolio minus an aggressive portfolio. Conservative stocks have low annual percentage changes in total assets, and aggressive stocks have high annual percentage changes in total assets.
- MOM: A portfolio sorted on the 12-month momentum.
Figure 1 shows monthly returns on each of the factors used for the last 10 years. Figure 3 shows the cumulative returns for the same factors, and for the same time frame. These are excess returns, above the risk-free interest rate. In reality, the funding cost for those portfolios are typically higher than the risk-free, but this is not reflected in this exercise.
The risk-free rate is removed from the funds’ returns prior to analysis, isolating excess returns. Our analysis obtains an exposure or loading for each of the six factors and alpha.
More specifically, the factor loadings (including the alphas) are estimated for each program separately, yielding a distribution of factor loadings and alphas at each point in time. We then aggregate the results for each of the different hedge fund strategies (i.e. Managed Futures, Equity Long-Short, Event-Driven, Market Neutral, Fixed Income, and Risk Premia strategies). We use a 24-month rolling window to determine the alpha and beta. As with most factor-based analysis, we have some benefit of hindsight as the regression is based on known data and there is no assurance that any allocator could have timed the beta successfully.
It is worth bearing in mind that these factors exclude fees and transaction costs and that the fees charged to the funds (management and performance fees) are head-line costs. Larger allocators would typically have a discount on those fees and the distribution would thus shift higher. Furthermore, some strategies may not be well modeled by any combination of these factors. We also acknowledge that the sample of hedge funds we are using suffers from a certain degree of backfill bias which may improve our results. Here we also note that the FF5 dataset has a short out of sample track-record (FF5 was published in 2014). All of this may shift the distribution of return slightly upward or downward over time, but the general trend should be the same.
In Figure 2, the fit between our factors and fund returns is shown. We find that most of the hedge funds, especially as of late, have higher R-Square values. The power of the regression seems to have improved throughout 2020 (partly due to increased synchronicity with equity markets) and our regression result is thus even more relevant in the period from 2020. The remaining style, CTA typically does not trade equity-related factors and tends to be diversified across global markets, rather than equity market-related risk that is the primary driver of the other strategies, but even there the R squared against our factors have increased slightly. Equity Long/Short and Market Neutrals strategies have relatively stable R squares.

As this is NilssonHedge’s first article in a series on funds’ factor exposures, we will not only show the latest figures but also discuss the historical data since 2005.
Last 10 years
Figure 2 shows how the distribution of alphas varies over the last ten years. The solid lines represent the median alpha over time, and the bands around it contain 50%, 70%, and 90% of programs respectively. Note that this is calculated on individual funds, and not on the aggregated index levels.

Equity Long-Short and CTAs do not seem to have had a significant shift from zero realized alpha, based on their distributions of excess returns at any point in time since 2015. Prior to that, we observe a higher degree of spread in the distribution around 2012-2013, coinciding with the European debt crisis.
For CTAs we note a skewed distribution, for instance, in early 2018 there was first a downward spike followed by a smaller upward spike in 2020, meaning that some “unlucky” CTA strategies lost more than their “skilled” counterparts won over this period. Event-Driven strategies suffered a blow around 2019. On the other hand, Fixed Income appears to have had mostly positive alphas for 2020. Hedge Funds, Market Neutral strategies, and Risk Premia have had some consistently negative alphas between mid-2018 and the end of 2019: even though some part of the distribution is above the 0% mark, most of it is underneath. Risk Premia strategies especially have suffered in 2019 and 2020.

We tie these losses, partly due to our focus on the more liquid strategies, but also due to the long-term underperformance for certain factors (value vs momentum, lack of returns and tail risk for short volatility strategies, etc.). An interesting observation is that two strategies that are traditionally exposed to liquidity risk (Event-Driven and Fixed Income) have a higher proportion of managers outperforming the selected factors.
Last 36 Months
As before, CTAs and Equity Long-Short strategies do not seem to have departed from 0% alpha, although the CTA distribution seems to be trending towards positive alphas for the last couple of months. A closer look at Event Driven reveals that, since mid-2019, these strategies have stayed mostly with a positive alpha, although this seems to be ending.
Fixed Income stays around 0% until the beginning of 2020 when it peeks above 0%. In aggregate, these strategies seem to have underperformed around 2019, but they look quite centered at 0%. Market Neutral remained quite neutral around 0% for the past 36 months. Risk Premia strategies’ distributions stay below 0% and with a negative skew as most of the managers have exhibited negative alpha.


Summary
We have performed a regression analysis of hedge funds grouped by strategy, and have found that it has been difficult to generate positive alpha (i.e. unexplained return) using a set of academic factors. The most remarkable results are found in the Risk Premia strategies where only a fraction of funds have delivered a net positive alpha. This is somewhat surprising given that Risk Premia strategies typically lean into academic factors. The lack of alpha could imply that most Factors have a poor result out-of-sample, despite being extraordinarily well researched.
The lack of alpha may be partly due to our factor selection, our focus on liquid strategies, but also due to a lack of strong outperformance for hedge funds compared to standardized factors. While we have delivered somewhat depressing findings, that is, the median fund barely performs on par with regression of well-known factors, this is good news for skilled fund selectors. The dispersion between the best and worst fund is relatively large and leaves plenty of room to deliver above-average returns by allocating to the better funds. Hardly easy, but the dispersion creates interesting opportunities. We will discuss persistence in a future article.
We intend to follow up with additional articles with more specific macro factors, deep dives into certain sectors where the factors are more relevant than in other sectors. We acknowledge that some of the results are impacted by survivorship and may overestimate alpha.
This article is co-authored by Alex Lostado and Linus Nilsson. This article was written using data as of February 2021. Charts will be updated but the text may eventually get unsynced.