
T-SQL is good when it comes to creating, maintaining, and analyzing time-series data. However, when you want to transform the data or aggregate it over a different form, the PIVOT command is useful. We are going to develop a tabular track-record presentation. An example of tabular track-record is shown below.

When it comes to presenting performance a tabular form is common due to the compactness of the format, with the year on the Y-axis and the Date on the X-axis. We present a quick solution for transforming a time series into a tabular form.
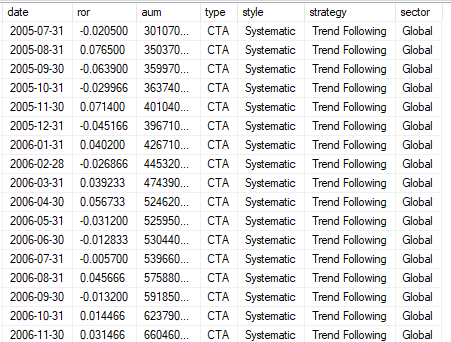
Our database is organized as a time series as seen above. Here, we use an internal view to extract data from the database. Our Performance table will be built from a number of functions. First, we extract the Month and Year of the table.

select year(date) as year,
month(date) as month,
convert(decimal(8,3),ror) as ror
from dbo.programview
where manager ='xx' and program ='yy'
The code is pretty straightforward, adding a few minor formatting options to reduce the noise in the data. For instance, we present a percentage with one decimal.
This will be the base query for our performance table. We start by using the PIVOT command to pivot the table:
select *
FROM
( select year(date) as year,
month(date) as month,
convert(decimal(8,3),ror) as ror
from dbo.programview
where manager ='xx' and program ='yy')
as SourceTable
PIVOT
( sum(ror)
 for month in ([1],[2], [3], [4],
[5], [6],[7],[8],
[9],[10],[11],[12])
) as PivotTable
This gives us a crude performance table, with number on the x-axis. This could have been solved using a different naming convention for the month part. But we did not do it here.

To further enhance the table, we substitute the numbers with the spelled out Month name and add a YTD column. In addition, we use an internal function, transforming the values to Percentage Format.
The final query looks complicated, but if you know the building blocks, it is easier to disentangle.
select top 5 year as ' '
, dbo.fmtPct([1],1) as 'Jan'
,dbo.fmtPct([2],1) as 'Feb'
, dbo.fmtPct([3],1) as 'Mar'
, dbo.fmtPct([4],1) as 'Apr'
, dbo.fmtPct([5],1) as 'May'
, dbo.fmtPct([6],1) as 'Jun'
,dbo.fmtPct([7],1) as 'Jul'
,dbo.fmtPct([8],1) as ' Aug'
,dbo.fmtPct([9],1) as 'Sep',
dbo.fmtPct([10],1) as 'Oct',
dbo.fmtPct([11],1) as 'Nov',
dbo.fmtPct([12],1) as 'Dec',
dbo.fmtpct( round( (1+coalesce([1],0))*(1+coalesce([2],0))*
(1+coalesce([3],0))*(1+coalesce([4],0))*
(1+coalesce([5],0))*(1+coalesce([6],0))*
(1+coalesce([7],0))*(1+coalesce([8],0))*
(1+coalesce([9],0))*(1+coalesce([10],0))*
(1+coalesce([11],0))*(1+coalesce([12],0))
-1 ,3),1) as YTD
FROM
( select year(date) as year
, month(date) as month,
convert(decimal(8,3),ror) as ror
from dbo.programview
where manager ='xx' and program ='yy') as SourceTable
pivot
(
sum(ror)
for month in ([1],[2], [3], [4], [5], [6],[7]
,[8],[9],[10],[11],[12])
) as PivotTable
group by year , [1],[2], [3], [4], [5], [6],[7]
,[8],[9],[10],[11],[12]
order by year desc
And now, you have a copy-able pivot-table directly from your SQL Server, without the use of any transformation with Excel’s pivot tables.

You must be logged in to post a comment.