
Dispersion is a way to characterize the shape of the distributions of returns. Here, we measure dispersion using the upper and lower quartiles (25th and 75th percentile) compared to the median, as an indication of how much funds selection matters contra strategy selection. In the charts below, 50% of the funds should be within the shaded area. If the distribution is skewed, that means that the losing funds lost or that the winning funds gained more than the median fund. This is not adjusted for volatility but rather based on the whole sample in the NilssonHedge hedge fund database.
If the dispersion is persistently high, Fund selection is key to generating above-average returns, when it is low, strategy selection typically matters more (e.g. Market Neutral, and Risk Premia). Variability in dispersion indicates episodic events for the strategy (e.g. Fixed Income, Event-Driven). If the fund returns are volatile but dispersion is comparatively tight, this may indicate a persistent beta (e.g. Long/Short Equity strategies).
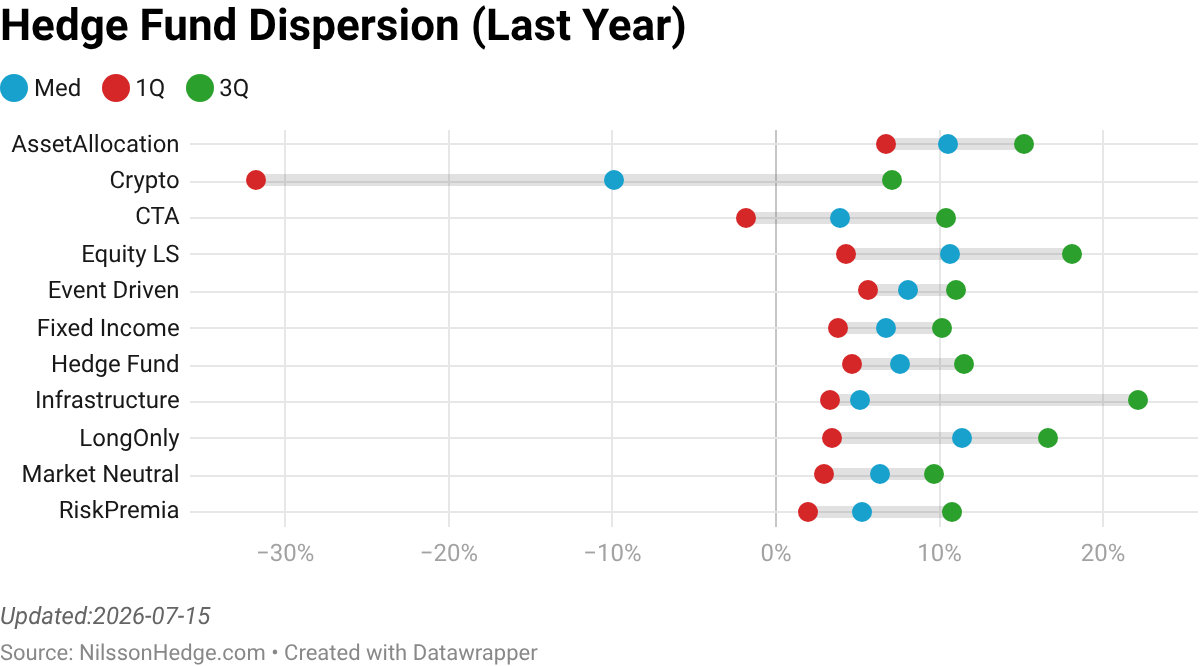


For strategies exposed to a variety of spreads (credit, liquidity, merger arbitrage, etc.) we note that dispersion increases across the board, where the outliers are typical to the downside. The latter is evident for Event-Driven, Fixed Income, and Risk Premia strategies that seem to suffer sharp losses and strong gains at approximately the same time, indicating a high degree of exposure to similar underlying strategy determinants. For strategies that strive to hedge out common exposure, we note that the dispersion is relatively uniform over time (i.e. Market Neutral).
To illustrate how important Fund Selection is in certain asset classes, we also calculate the Year-To-Date and the three Year-To-Date results. These charts are impacted by backfill biases but serve as a good indicator if a particular (surviving) fund has done a good job or not. We measure the cumulative performance for all funds in the database, and calculate the medain, upper, and lower quartile performance for each date.
These charts are updated continuously and all statistics reflect monthly data and time horizons.
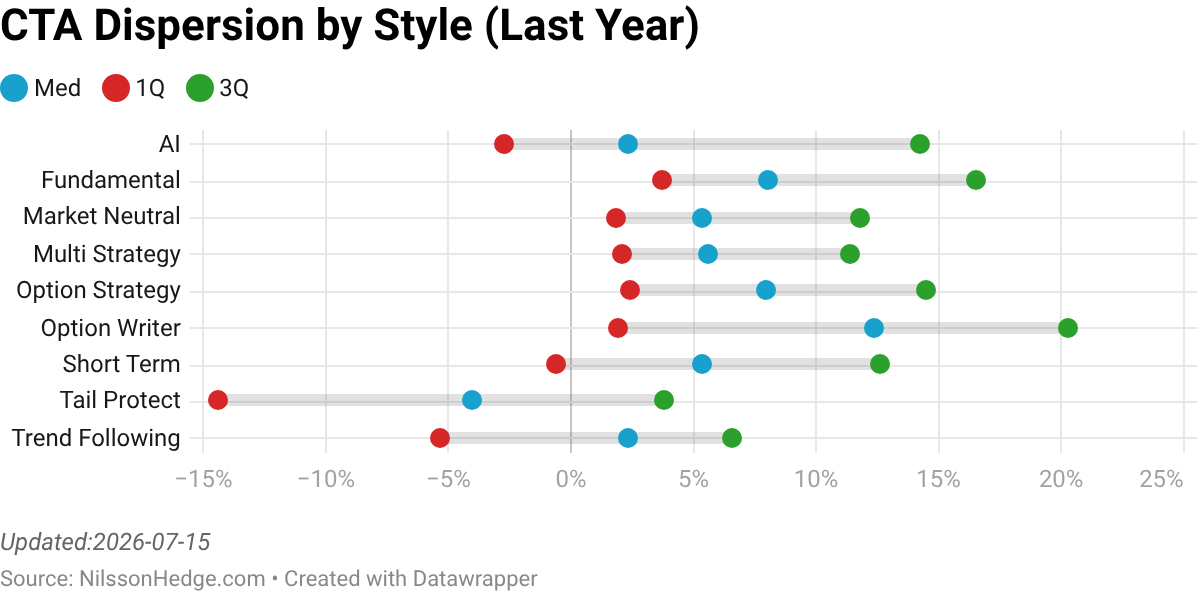
CTA
As the CTA universe is diverse, in terms of underlying strategies, we present a deeper dive into the dispersion statistics. Here we have calculated this for each sub-strategy. The year-to-date and month-to-date, show the managers that have updated returns for the month. The content will dynamically change over the month.


Crypto
Equity Long/Short
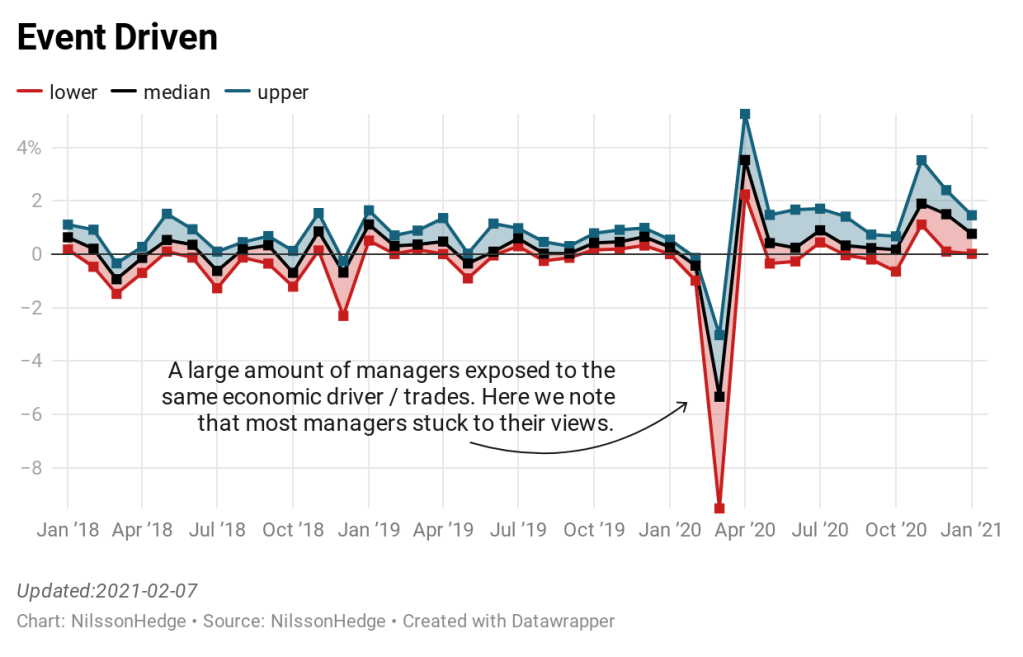
Event Driven
Fixed Income
Market Neutral
Risk Premia
Reading Notes
To aid the reader in interpreting the charts, we publish four typical situations. We typically learn more from manager behavior during stressed markets rather than during calm periods. We note that CTAs had large variability of returns and for you to earn some degree of Crisis Alpha during the Covid meltdown in 2020, but manager selection was key to extracting that premium. The positively skewed distribution during the period meant that a correct pick more than offset an incorrect pick.
For Event-Driven managers, we note that a strong selloff followed by an almost similar-sized recovery of returns indicates that the managers did not change positions significantly. Market Neutral managers are the strategy with the lowest dispersion and have thus managed to hedge market risk successfully. For the most volatile group of managers, the Crypto Strategies, there is a high dispersion, but most managers gain when the average manager had a positive month and vice versa. This would indicate a relatively strong beta component (e.g. exposure to BTC).


You must be logged in to post a comment.