
One of the more recent innovations in the CTA universe is that trend following strategies can be accessed through the ETF format. These securities typically have to make design decisions to fit market makers (i.e. fewer markets are preferred over more markets, slower trading strategies, and a preference for US Futures). There is more day-to-day trading in these than what a typical CTA would expect and therefore these are generally sound design choices. Focus on liquidity and predictability. Obviously, there are also Exchange Traded Funds that have a different market selection.
In most cases, these are solutions that work well or even better than well as seen through most of 2022 where ETFs outperformed our index due to a higher allocation to short fixed-income futures.
Except when you have idiosyncratic moves such as the super trend in Cocoa.
We have only found the Trend Following ETFs with a small exposure to Cocoa and there is a comparatively small exposure. In the first quarter of 2024, this is a decision that has influenced the performance of fully fledged vs liquidity-focused managers.

To create a fair comparison, we create an average of the largest Managed Futures ETFs and compare that to the volatility-adjusted NilssonHedge CTA Index. Given the short time horizon, we do not adjust for interest rate earnings. We note that the Volatility Adjusted Index has done better than the ETF Composite. Some of this relates to fixed income and currency trading, where managers have been whipsawed. Some of of it relates to the Food of the Goods, Cocoa, which has been a significant contributor to many CTAs.
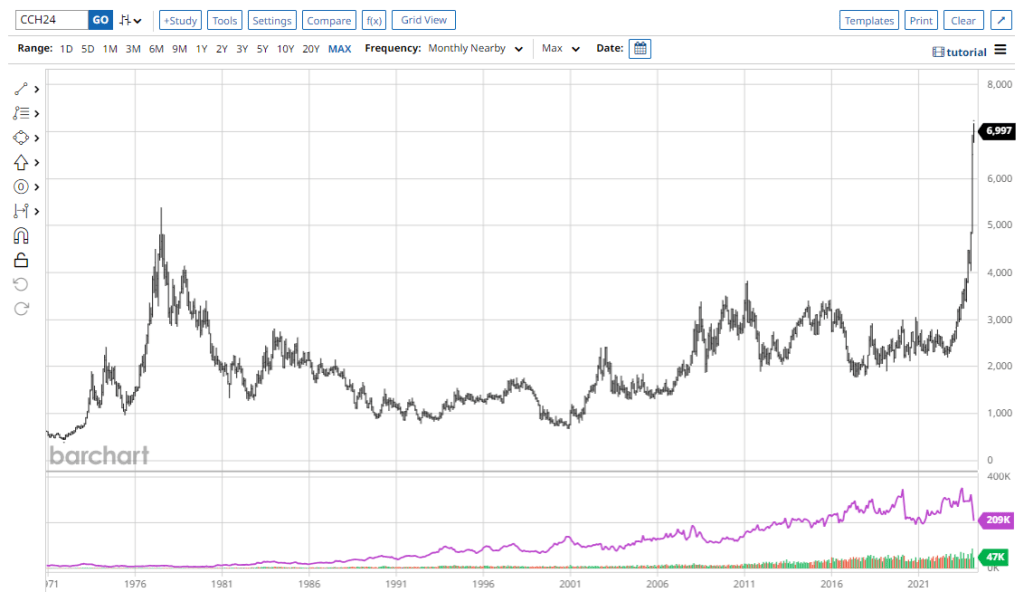
When the trend eventually bends, we will who has managed to protect their profits, and who was late through the door. Cocoa is not the most liquid commodity market. Recently the trend has flattening and we have seen Volume and Open Interest decline.
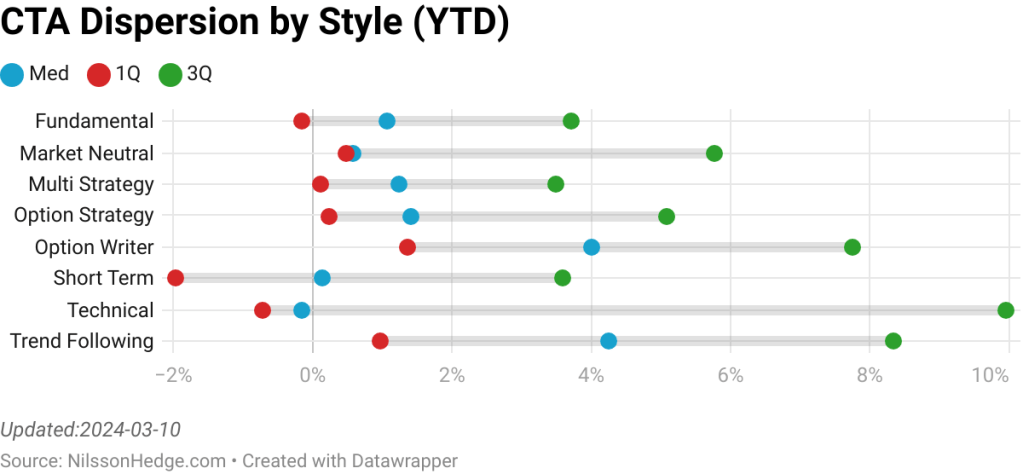
Using our dispersion measure across CTA strategies, we note that the span (with only two months of return data) is wide, ranging from around 1% to above 8%. We expect the range to be reduced, but this should serve as a reminder that not all strategies are the same. Remember that we are looking at the first and third quartile dispersion and 50% of the the managers are better or worse. Early reporting and other database biases may contribute to the dispersion.

Picking CTAs is not an easy sport, and in most cases, you need more than one to pick up the risk premia. Market selection, and time frames are short and long-term determinants of the realized performance.