
With a an eye toward one of the more epic Public Service Announcement, we dig into recent position changes for Trend Following strategies. CTAs have recently changed their positions rather radically. The increased uncertainty in the Middle East and what looks like a postponement of the start of the FOMC easing cycle has caused positions and correlations to change. In this short post we try to ensure that you know where your CTAs are.
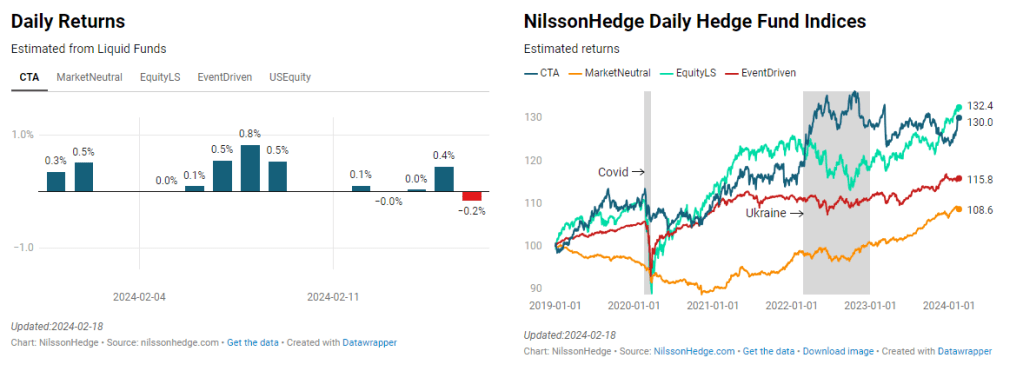
CTAs had a really good start to February, with ten positive days out of twelve observations and eight continuous positive trading days from the 1st to the 12th. The string of eight positive days is unusual, we have seen only nine prior observations that was of the same length or longer. The longest run of ten positive days took place just a few days ahead of the 2023 Fixed Income reversal that wrecked havoc to Trend Followers. Other runs have not resulted in subsequent losses.
We try to keep track of the major exposure through a number of different metrics:
- Daily Indices
- Correlation to Major Exposures.
- Sector / Market Positions through ETF data (limited data available upon request).

When looking across the sectors that CTAs have exposure to, we note that Long Exposure in fixed income has moderated somewhat as the FED has toned down the chance of an early reduction in the policy rate. This had a strong impact on performance of the US Dollar, and managers added to their long USD positions (shown as a short position above as the Futures are typically long the foreign currency). Energy markets are back in long territory, as the increasing uncertainty surrounding the situation in the Middle East drove prices higher.
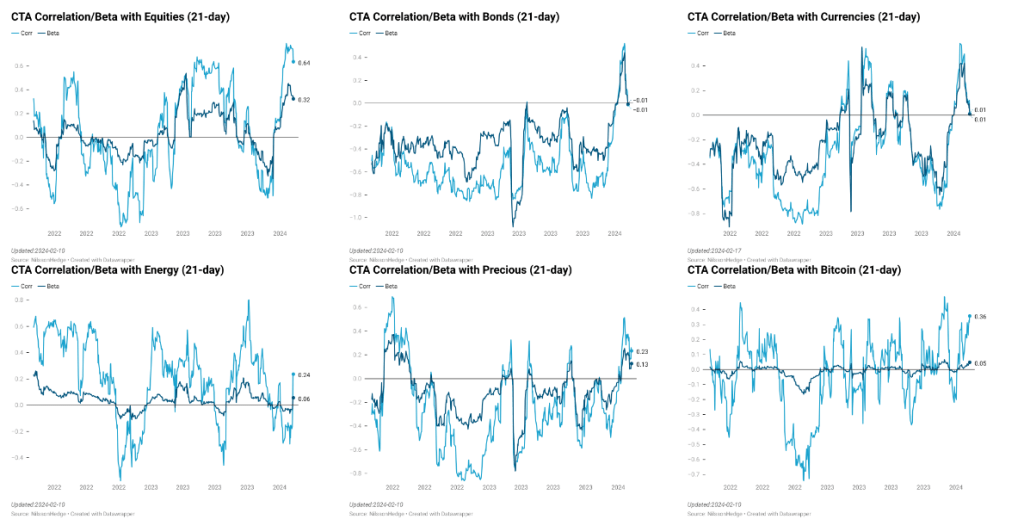
Correlation is a lagged measure compared to position data. We note that the Currencies exposure has gone from a solid short US Dollar exposure to a flat correlation. This measure is thus lagging the observation we see in actual position data. Likewise, the bond positions are back to zero correlation which may highlight that non-ETF managers are responding more rapidly to price changes than the ETFs are. Or that our correlation measure is picking up something different than pure fixed income exposure.

In terms of underlying positions, Equity Futures represent the largest longs and short positions in Euro and Yen represent the largest shorts. Fixed Income positions (re-adjusted to 10-year equivalents) are long except for exposure to the short end of the curve.

Cocoa has been one of the Futures markets that has caused headlines. The Financial Times recently covered this: “Hedge fund stampede into cocoa futures fuels record price jump“. For the strategies we follow, we do not observe an Cocoa futures and given the relatively low liquidity of the market, do not blame your trend followers, but Discretionary traders and perhaps panicked commercial participants that are scrambling to find supply at a good price. For Trend Follower, Cocoa is a long exposure.
We appreciate that you follow our website. Please feel free to reach out to discuss your data needs or analytics that we can assist you with.